Returns
Returns processing is the warehouse process of receiving, inspecting, dispositioning, and restocking products returned by customers, managing reverse logistics efficiently.
Returns Processing Overview
Interactive overview of returns technologies and strategies - click to explore each category
Returns Management
Inspection & Grading
Disposition Management
Customer Experience
Process Flow and Business Characteristics
Return authorization validates that returns are eligible and provides instructions for customers. Return merchandise authorization (RMA) systems generate unique identifiers linking returns to original orders, return policies define eligibility criteria (time limits, condition requirements, restocking fees), and return labels simplify the return process for customers. Automated authorization approves eligible returns instantly, while manual review handles exceptions or high-value items. Return reasons (wrong item, defective, changed mind) inform disposition decisions and identify quality or fulfillment issues.
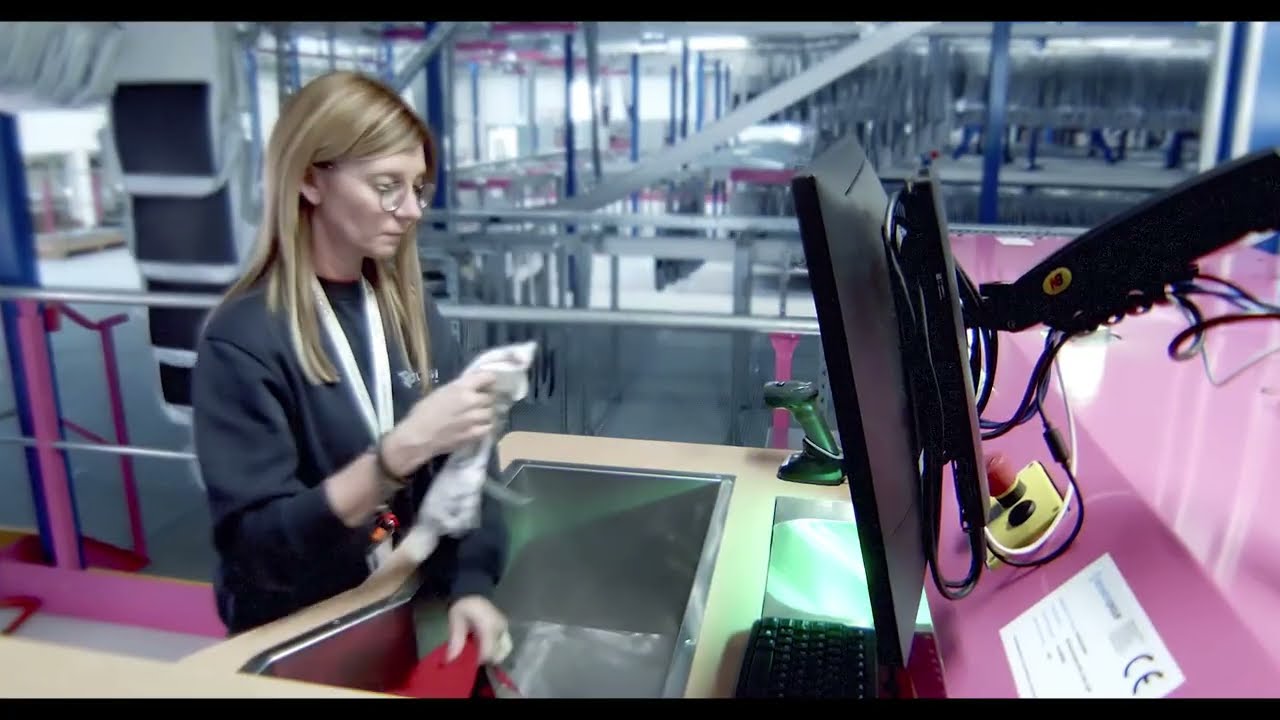
Receiving and identification process returned shipments as they arrive. Carrier returns come through standard shipping channels, in-store returns (for omnichannel retailers) arrive from retail locations, and bulk returns from retailers or distributors arrive on pallets. RMA scanning links physical returns to authorization records, condition assessment provides initial evaluation (unopened, opened, damaged), and quarantine staging holds returns until inspection. Receiving accuracy ensures all returned items are captured and tracked.
Inspection and testing evaluate product condition and functionality to determine appropriate disposition. Visual inspection identifies packaging damage, missing components, or obvious defects. Functional testing verifies that products operate correctly, with test protocols varying by product complexity (simple function checks for basic items, comprehensive testing for electronics or machinery). Quality standards define acceptable condition for restocking, with cosmetic damage, missing packaging, or functional defects affecting disposition. Inspection time varies from 30 seconds for simple items to 15-30 minutes for complex products.
Disposition decisions determine how to handle returned products based on condition and business rules. Restock to inventory returns saleable items to available stock, typically 40-60% of returns in e-commerce operations. Refurbish or repair restores products to saleable condition through cleaning, repackaging, or component replacement, handling 10-20% of returns. Liquidate or salvage sells damaged or obsolete products to secondary markets at discounted prices, covering 15-25% of returns. Dispose or recycle handles unsaleable products, representing 10-20% of returns, with environmental regulations governing disposal methods.
Processing and restocking execute disposition decisions to recover value. Restocking returns items to inventory with location assignments and system updates, refurbishment cleans, repackages, or repairs products to restore saleable condition, repackaging replaces damaged packaging while preserving product integrity, and component harvesting recovers valuable parts from unsaleable products. Quality control verifies that processed items meet standards before returning to inventory. Cycle time from receipt to disposition affects inventory availability and customer refund timing.
Automation Technologies
Return management systems (RMS) orchestrate returns processing, managing authorizations, tracking returns, directing disposition, and coordinating refunds. Automated authorization approves eligible returns based on order history and return policies, workflow management routes returns through inspection and processing steps, and disposition rules engines determine handling based on product condition and business rules. Integration with WMS enables inventory updates and restocking, while integration with order management triggers refunds or replacements. Analytics identify return patterns indicating quality or fulfillment issues.
Warehouse management systems (WMS) coordinate returns processing with forward logistics operations, managing receiving, inspection workflows, inventory adjustments, and restocking. Returns receiving captures returned items with RMA scanning and condition assessment, inspection task management directs workers through evaluation protocols, and disposition execution processes restocking, refurbishment, or disposal. Inventory accuracy maintains separate tracking for returned items until disposition, preventing premature availability. Integration with RMS enables seamless data flow.
Automated inspection systems use vision and sensors to evaluate product condition, reducing manual inspection time by 40-60%. Vision systems photograph products from multiple angles, with AI algorithms detecting damage, missing components, or packaging issues. Barcode verification confirms product identity and detects wrong items. Weight verification identifies missing components or wrong products. Functional testing automation for electronics uses automated test equipment to verify operation, handling 200-400 items per hour compared to 30-60 per hour manually.
Robotic refurbishment systems automate cleaning, repackaging, and component replacement for returned products. Robotic cleaning uses brushes, air jets, or cleaning solutions to restore product appearance, automated repackaging places products in new packaging with inserts and labels, and component replacement uses vision-guided robots to swap damaged parts. These systems handle 300-600 items per hour for suitable products, improving consistency and reducing labor costs by 50-70%.
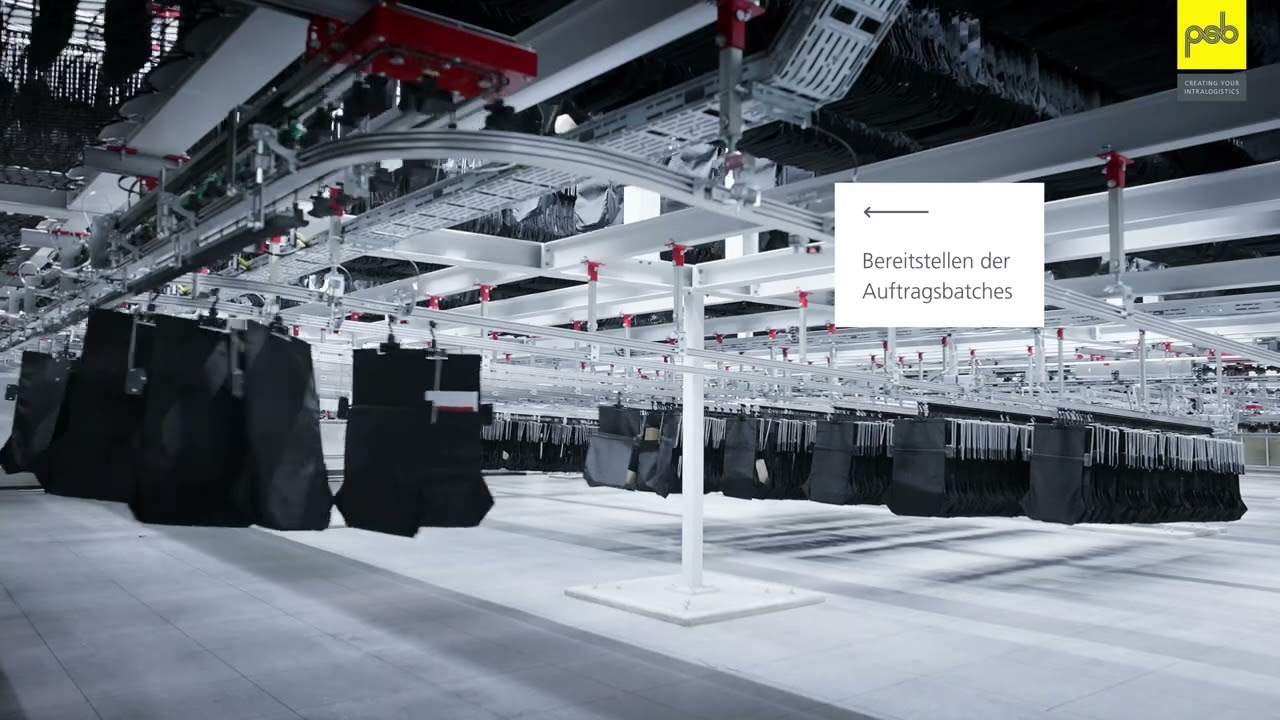
Sortation systems route returned products to appropriate disposition areas based on inspection results. Automated sorters (tilt-tray, cross-belt, sliding-shoe) divert items to restock, refurbish, salvage, or disposal areas at rates of 3,000-6,000 items per hour. Put-to-light systems guide manual sorting with visual displays, achieving 300-600 sorts per hour per worker. Conveyor networks transport returns between receiving, inspection, processing, and restocking areas, creating continuous flows.
Reverse logistics software optimizes returns network design, transportation, and processing. Network optimization determines optimal locations for returns processing centers considering transportation costs, processing costs, and service requirements. Transportation optimization consolidates returns shipments to reduce costs, with carrier integration enabling return label generation and tracking. Processing optimization balances speed (rapid refunds) against cost recovery (thorough inspection and refurbishment). Analytics identify opportunities to reduce return rates through quality improvements or better product descriptions.
Sustainability tracking systems monitor environmental impact of returns processing, measuring recycling rates (percentage of returns recycled vs. landfilled), refurbishment rates (percentage restored to saleable condition), material recovery (components or materials harvested), and carbon footprint (transportation and processing emissions). Compliance tracking ensures adherence to environmental regulations for electronics recycling, hazardous materials disposal, and packaging waste. Reporting supports sustainability goals and regulatory requirements.
Key Performance Indicators
Return rate measures returns as a percentage of sales, with typical rates of 5-10% for general retail, 15-30% for apparel, and 30-40% for online apparel. Return reasons (wrong item, defective, changed mind, wrong size) identify root causes requiring attention. High return rates indicate quality problems, inaccurate product descriptions, sizing issues, or fulfillment errors. Return rate by product and supplier identifies specific problems requiring corrective action.
Restock rate measures the percentage of returns restored to saleable inventory, with targets typically 50-70% for e-commerce operations and 60-80% for B2B operations. High restock rates indicate good product quality and customer handling, while low rates suggest quality problems or damage during return shipping. Disposition mix (restock, refurbish, salvage, dispose) affects cost recovery, with refurbishment recovering 60-80% of value and salvage recovering 10-30%.
Returns processing cycle time measures elapsed time from receipt to disposition and customer refund, with targets typically 2-5 business days for most operations. Rapid processing improves customer satisfaction through faster refunds and improves inventory availability through quicker restocking. Inspection time (30 seconds to 30 minutes per item) and refurbishment time (5-60 minutes per item) drive overall cycle time. Automation reduces cycle time by 30-50% through faster inspection and processing.
Returns processing cost per item combines labor costs (receiving, inspection, refurbishment), transportation costs (return shipping), and disposal costs (recycling, landfill) divided by items processed. Typical costs range from $5-15 per item for simple products to $25-100+ for complex products requiring extensive testing or refurbishment. Automation reduces costs by 30-50% through improved productivity, while prevention (reducing return rates) provides even greater savings by eliminating returns entirely.
Cost recovery rate measures value recovered from returns as a percentage of original product value, with targets typically 50-70% for e-commerce operations. Restocked items recover 90-100% of value, refurbished items 60-80%, salvaged items 10-30%, and disposed items 0%. Disposition optimization maximizes recovery by accurately assessing condition and selecting appropriate handling. Secondary market channels (liquidators, outlet stores, online marketplaces) affect salvage recovery rates.
Customer satisfaction with returns process affects loyalty and repeat purchases. Refund speed (time from return to refund), process simplicity (easy return labels, clear instructions), and policy fairness (reasonable time limits, no restocking fees) drive satisfaction. Net promoter score (NPS) and customer satisfaction (CSAT) surveys measure returns experience. Negative returns experiences cause 30-50% of customers to avoid future purchases, making returns process quality critical to retention.
By implementing effective returns processing supported by appropriate automation technologies, warehouses maximize value recovery from returned products while maintaining customer satisfaction and minimizing environmental impact of reverse logistics operations.
Related Topics
Packing
Packing is the warehouse process of preparing picked items for shipment by placing them in appropriate containers with protective materials, labels, and documentation to ensure safe delivery.
Palletizing
Palletizing is the warehouse process of arranging products onto pallets in stable, efficient patterns for storage, transportation, and handling as unit loads.
Picking
Picking is the warehouse process of retrieving products from storage locations to fulfill customer orders, representing the most labor-intensive and cost-critical operation in most facilities.
Receiving
Receiving is the inbound warehouse process where shipments arrive, are verified, inspected, and documented before entering inventory, establishing the foundation for accurate warehouse operations.
Shipping
Shipping is the warehouse process of preparing completed orders for carrier pickup, including manifesting, staging, loading, and documentation to ensure timely delivery to customers.
Sorting
Sorting is the warehouse process of separating and routing products to designated destinations based on order, carrier, route, or other criteria to enable efficient distribution.
Storage
Storage is the warehouse process of holding inventory in organized locations until needed, balancing space utilization, accessibility, and inventory control to support efficient operations.
Transport
Transport is the warehouse process of moving materials, products, and equipment between locations within the facility to support receiving, storage, picking, and shipping operations.
Truck Loading
Truck loading is the warehouse process of placing shipments into trailers efficiently to maximize space utilization, ensure load stability, and enable efficient delivery operations.